TREND REVERSAL PRICE ACTION
 Select an element to maximize. Press ESC to cancel.
Read More
Uptrend
An uptrend is an overall move higher in price, created by higher highs and higher lows.
It describes when the price is moving upward or getting higher.
The uptrend is therefore composed of higher swing lows and higher swing highs.
As long as the price is making these higher swing lows and higher swing highs, the uptrend is considered intact.
Once the price starts making lower swing highs or lower swing lows, the uptrend is in question or has reversed into a downtrend.

Higher Peaks and Troughs
Higher peaks and troughs characterize uptrends with higher highs and higher lows taking place.
A peak refers to the highest point. A trough is the lower point.
In an uptrend, each successive peak and trough is higher than the ones found earlier in the trend.
An uptrend is characterized by the chart’s peaks and troughs reaching new highs as the trend progresses.
So, if you look at the chart over time, it may be zigzagging, but it’s generally going up.
How to Trade an Uptrend
Traditionally, the way to spot an uptrend is to look for higher highs, as well as higher lows.
That’s because buyers are active and driving up the price. They’re also quicker to buy in on dips.
Traders utilize trend lines to identify an uptrend and spot possible trend reversals.
The trend line is drawn along the rising swing lows, which helps show where future swing lows may form.
An uptrend provides traders with an opportunity to profit from rising asset prices.
Selling an asset once it has failed to create a higher peak and trough is one of the most effective ways to avoid large losses that can result from a change in trend.
The price should be making higher swing highs and higher swing lows to confirm that an uptrend is present.
When an asset fails to produce higher swing highs and lows, it means that a downtrend could be underway, the asset is ranging, or the price action is choppy and the trend direction is hard to determine.
In such cases, traders may opt to step aside until an uptrend is clearly visible.
Trading Tips
- Look for prices to reach previous lows but are not able to breakthrough. This is a good indication that sellers are no longer sellers and we could be setting up for a move higher.
- Use previous lows as a stop location
- Look for a break in previous highs to confirm the uptrend.
- Profits should be taken as prices flush above previous highs and stops should be adjusted to the last previous low.
- Trends are temporary. Even if they are strong or have a potential for making profits, never risk too much on any one trade.
Downtrend
A downtrend is an overall move lower in price, created by lowers lows and lower high.
A downtrend describes the price movement of a financial asset when the overall direction is downward.
In a downtrend, each successive peak and trough is lower than the ones found earlier in the trend.
The downtrend is therefore composed of lower swing lows and lower swing highs.
As long as the price is making these lower swing lows and lower swing highs, the downtrend is considered intact.
Once the price starts making higher swing highs or higher swing lows, the downtrend is in question or has reversed into an uptrend.

Lower Peaks and Troughs
Lower peaks and troughs characterize downtrends with lower lows and lower highs taking place.
A peak refers to the highest point. A trough is the lower point.
A downtrend is characterized by the chart’s peaks and troughs reaching new lows as the trend progresses.
So, if you look at the chart over time, it may be zigzagging, but it’s generally going down.
How to Trade a Downtrend
Traditionally, the way to spot a downtrend is to look for lower lows, as well as lower highs.
That’s because there are too many sellers and too little demand, so the price goes down.
The highs are also lower because sellers are motivated to get rid of their position, and there aren’t enough buyers to step in and replace them.
Traders utilize trend lines to identify a downtrend and spot possible trend reversals.
The trend line is drawn along the falling swing highs, which helps show where future swing highs may form.
A downtrend is when price action is moving lower over a period of time and is most recognizable by prices creating lower lows and lower highs.
A downtrend provides traders with an opportunity to profit from falling asset prices.
Buying an asset once it has failed to create a lower peak and trough is one of the most effective ways to avoid large losses that can result from a change in trend.
The price should be making lower swing lows and lower swing highs to confirm that a downtrend is present.
When an asset fails to produce lower swing highs and lows, it means that an uptrend could be underway, the asset is ranging, or the price action is choppy and the trend direction is hard to determine.
In such cases, traders may opt to step aside until a downtrend is clearly visible
Trading Tips
- Look for prices to reach previous highs but are not able to breakthrough. This is a good indication that buyers are no longer buying and we could be setting up for a move lower.
- Use previous highs as a stop location
- Look for a break in previous lows to confirm the downtrend
- Profits should be taken as prices flush below previous lows and stops should be adjusted to the last previous high.
- Trends are temporary. Even if they are strong or have a potential for making profits, never risk too much on any one trade.
Read More
A trend channel is a set of parallel trend lines defined by the highs and lows of an asset’s price action.
A trend channel, also sometimes called a price channel occurs when the price is moving between two parallel trendlines.
Trend channels can be drawn on charts to help see uptrends and downtrends.

In a bullish trend, the trend line is plotted below the price action, while the trend channel line is positioned above the highs of the price movement.
In a bearish trend, the trend line is plotted above, while the trend channel line is below the price action.
In general, trend lines are used as entry signals because they play the role of a support level in a bullish trend and a resistance level in a bearish trend.
An entry signal is given when the price tests the trend line without violating it. When this happens, the trade is entered in the direction of the trend with a stop loss placed just below the trend line. The opposite trend line can be used as a price target at which to take profit.
For example, in an ascending channel, traders may use the test of the LOWER trend line as an entry for a trade with the trend. A long position is entered with a stop loss placed just below the lower trend line. The upper trend line can used as the profit target.
Trend channel lines most often generate countertrend entry signals, since they act as a resistance in uptrends and support in downtrends.
For example, in an ascending channel, aggressive traders may use the test of the UPPER trend line as an entry for a trade against the trend (countertrend). A short position is entered with a stop loss placed just above the upper trend line. The lower trend line can used as the profit target.
Types of Channels
Parallel lines form trend channels, which just as the trend itself can be ascending, descending, or sideways (ranging).
- Ascending channel (higher highs and higher lows)
- Descending channel (lower highs and lower lows)
- Sideways or horizontal channel (ranging)

Trend Channels Can Becomes Triangles
When the slope of the trend line and trend channel line transition from being parallel, to being convergent, the trend channel forms a descending triangle.
When the slope of the trend line and trend channel line transition from being parallel, to being divergent, the trend channel forms an ascending triangle.
Read More
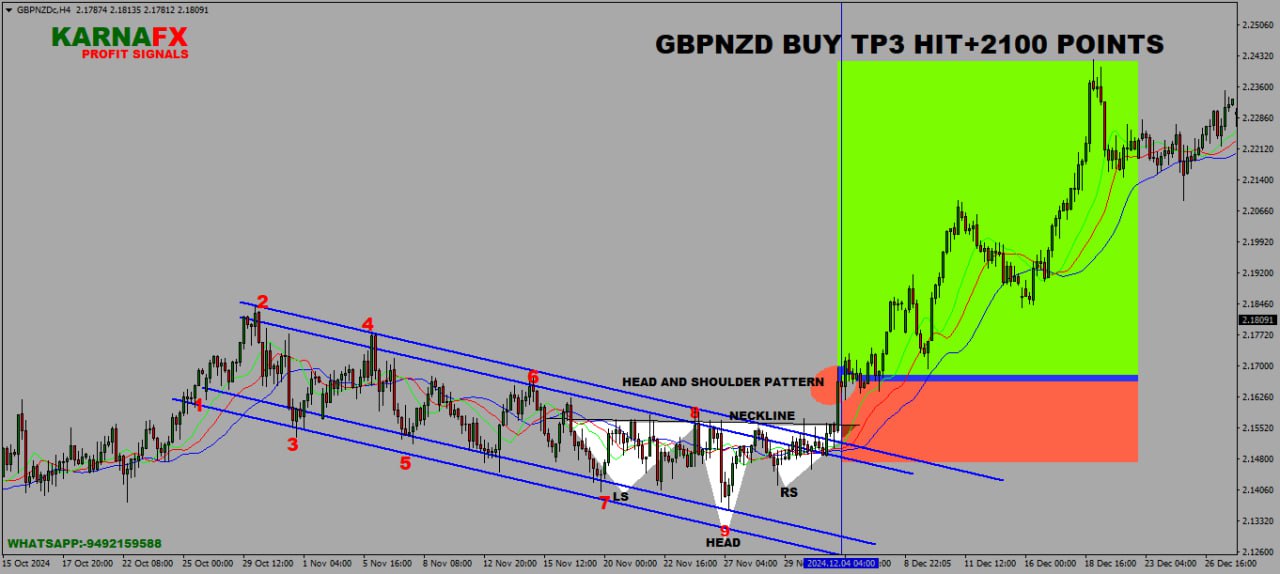
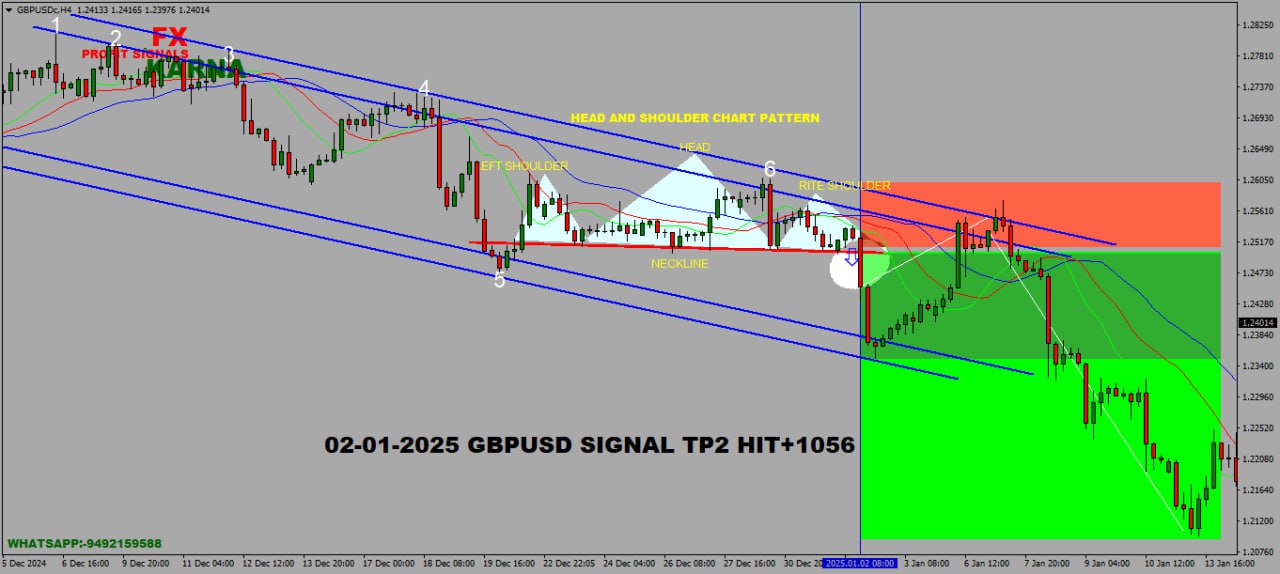
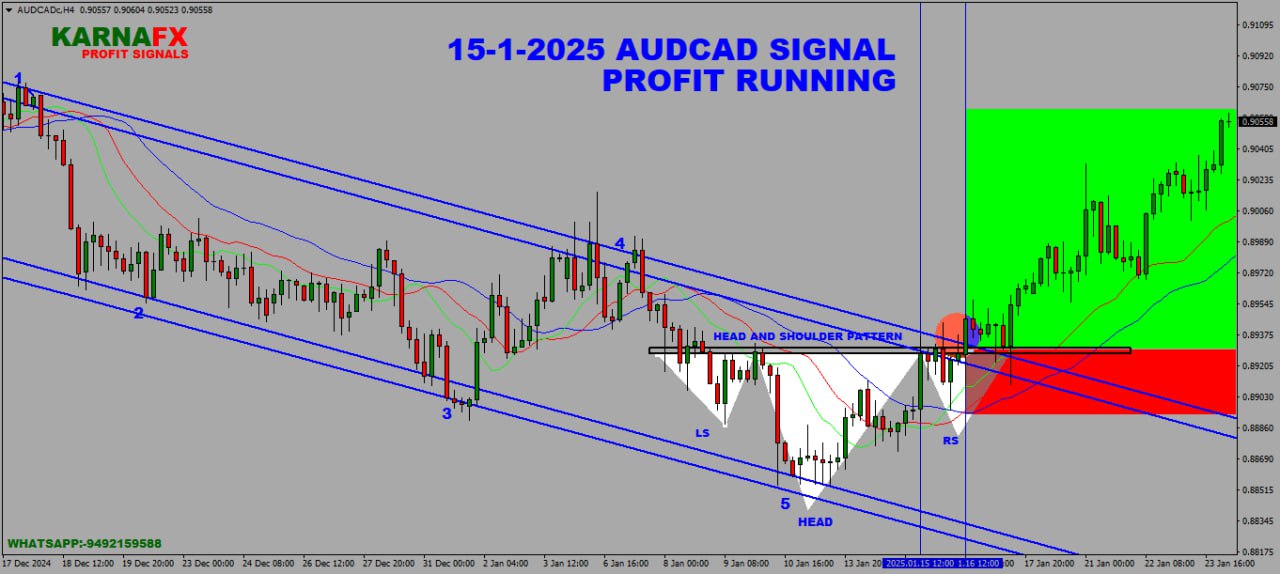
A head and shoulders pattern is also a trend reversal formation.
It is formed by a peak (shoulder), followed by a higher peak (head), and then another lower peak (shoulder).
A “neckline” is drawn by connecting the lowest points of the two troughs.
The slope of this line can either be up or down. Typically, when the slope is down, it produces a more reliable signal.

In this example, we can easily see the head and shoulders pattern.
The head is the second peak and is the highest point in the pattern. The two shoulders also form peaks but do not exceed the height of the head.
With this formation, we put an entry order below the neckline.
We can also calculate a target by measuring the high point of the head to the neckline.
This distance is approximately how far the price will move after it breaks the neckline.

You can see that once the price goes below the neckline it makes a move that is at least the size of the distance between the head and the neckline.
We know you’re thinking to yourself, “the price kept moving even after it reached the target.”
And our response is, “DON’T BE GREEDY!”
Inverse Head and Shoulders
The name speaks for itself. It is basically a head and shoulders formation, except this time it’s upside down. 🙃
A valley is formed (shoulder), followed by an even lower valley (head), and then another higher valley (shoulder).
These formations occur after extended downward movements.

Here you can see that this is just like a head and shoulders pattern, but it’s flipped upside down.
With this formation, we would place a long entry order above the neckline.
Our target is calculated just like the head and shoulders pattern.
Measure the distance between the head and the neckline, and that is approximately the distance that the price will move after it breaks the neckline.

You can see that the price moved up nicely after it broke the neckline.
If your target is hit, then be happy with your profits.
However, there are trade management techniques where you can lock in some of your profits and still keep your trade open in case the price continues to move your way.
Read More
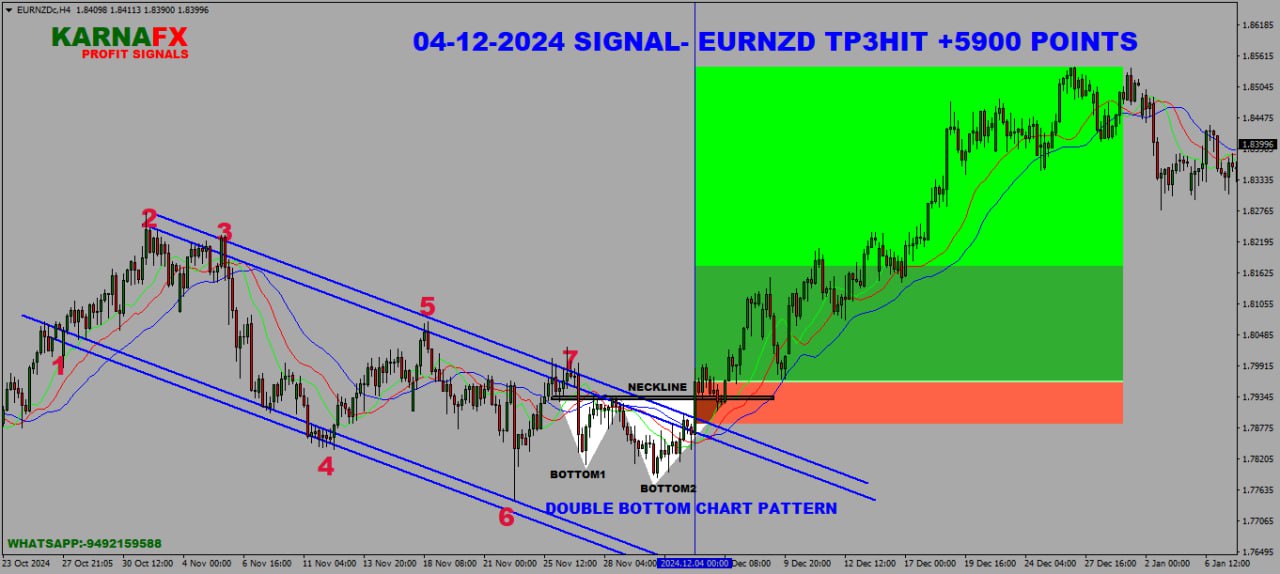
How to Trade Double Tops and Double Bottoms
Let’s learn how to identify these chart patterns and trade them.
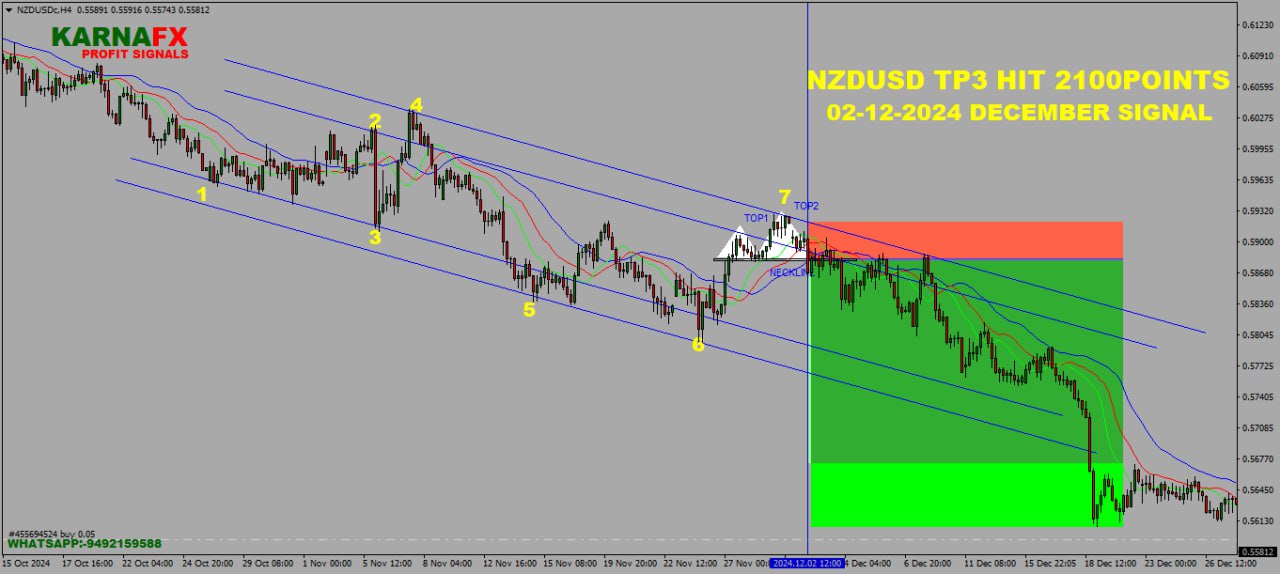
Double Top
A double top is a reversal pattern that is formed after there is an extended move up.
The “tops” are peaks that are formed when the price hits a certain level that can’t be broken.
After hitting this level, the price will bounce off it slightly, but then return back to test the level again.
If the price bounces off of that level again, then you have a DOUBLE top!

In the chart above you can see that two peaks or “tops” were formed after a strong move up.
Notice how the second top was not able to break the high of the first top.
This is a strong sign that a reversal is going to occur because it is telling us that the buying pressure is just about finished.
With the double top, we would place our entry order below the neckline because we are anticipating a reversal of the uptrend.

Wow! We must be psychic or something because we always seem to be right!
Looking at the chart you can see that the price breaks the neckline and makes a nice move down.
You’ll also notice that the drop is approximately the same height as the double top formation.
Keep that in mind because that’ll be useful in setting profit targets.
Double Bottom

The double bottom is also a trend reversal formation, but this time we are looking to go long instead of short.
These formations occur after extended downtrends when two valleys or “bottoms” have been formed.

You can see from the chart above that after the previous downtrend, the price formed two valleys because it wasn’t able to go below a certain level.
Notice how the second bottom wasn’t able to significantly break the first bottom.
This is a sign that the selling pressure is about finished, and that a reversal is about to occur.

Will you look at that!
See how the price jumped by almost the same height as that of the double bottom formation?
Remember, just like double tops, double bottoms are also trend reversal formations.
Read More
Triple Bottom
A Triple Bottom is a chart pattern that consists of three equal lows followed by a break above resistance.
The chart pattern is categorized as a bullish reversal pattern.
All three highs should be reasonably equal, well-spaced, and mark clear turning points to establish support.
The lows do not all have to exactly the same level but should be “close enough”.
That said, patterns where the last bottom is higher than the middle usually provide better results.

The Triple Bottom pattern is similar in appearance to the Inverse Head and Shoulders pattern, in that it is represented by a series of three high highs and lows.
The difference is that all three highs of the Triple Bottom will be around the same height, while in the Inverse Head and Shoulders pattern, the second lowe is lower than the first and third high.
The appearance of the Triple Bottom indicates the existence of a downtrend, which is currently in the process of reversing into an uptrend.
Selling pressure is declining so the downtrend is running out of steam.
As with a Triple Top, it is generally thought that the longer a particular trend takes to fully develop, the stronger the significant change in price once a breakdown occurs.
Triple Tops and Bottoms are considered one of the slowest types of chart patterns to fully mature.
While the Triple Bottom is developing, it can look like other chart patterns.
For example, before the third high forms, the pattern may look like a Double Bottom.
Three equal highs can also be found in a Descending Triangle or Rectangle.
With a Triple Bottom, the support level can be identified by drawing a line at the base level of the high, which forms a “Neckline“.
You can choose to enter into a long position once the price level rises through this resistance level.
The Triple Top should also be treated as a neutral chart pattern until a breakout occurs.
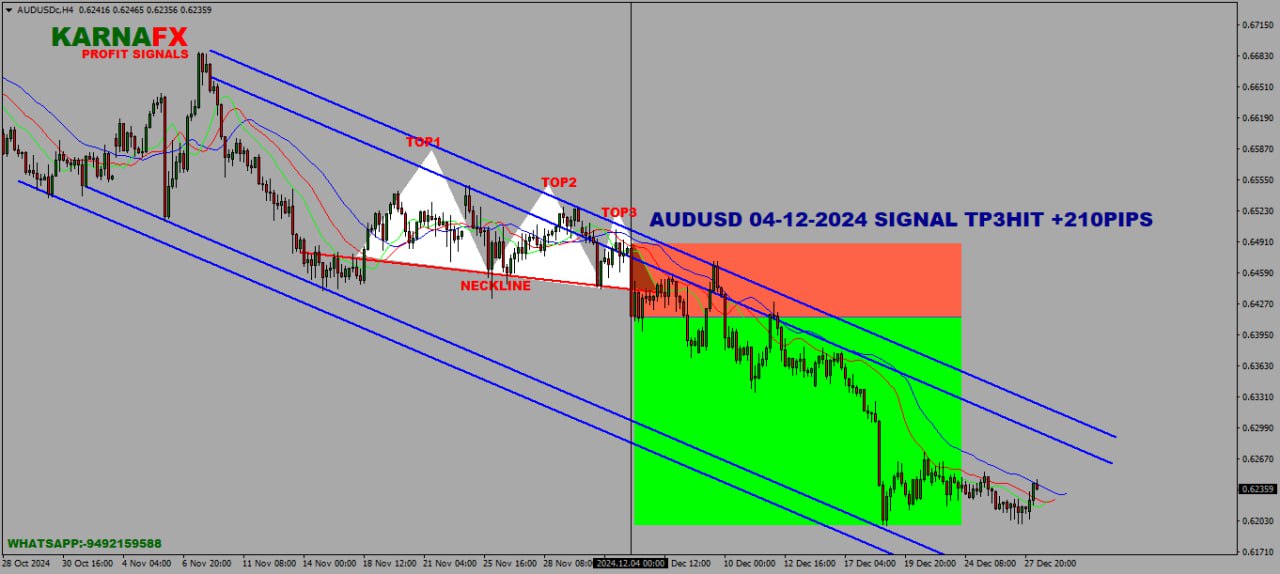
Triple Top
A Triple Top is a chart pattern that consists of three equal highs followed by a break below support.
The chart pattern is categorized as a bearish reversal pattern.
All three highs should be reasonably equal, well-spaced, and mark clear turning points to establish resistance.
The highs do not all have to exactly the same level but should be “close enough”.
That said, when the last high fails to reach the middle high’s value, the trend might be getting exhausted, and a stronger decline can be expected.

The Triple Top pattern is similar in appearance to the Head and Shoulders pattern, in that it is represented by a series of three high highs and lows.
The difference is that all three highs of the Triple Top will be around the same height, while in the Head and Shoulders pattern, the second high is higher than the first and third high.
The appearance of the Triple Top indicates the existence of an uptrend, which is currently in the process of reversing into a downtrend.
Buying pressure is declining so the uptrend is running out of steam.
As with a Triple Bottom, it is generally thought that the longer a particular trend takes to fully develop, the stronger the significant change in price once a breakdown occurs.
Triple Tops and Bottoms are considered one of the slowest types of chart patterns to fully mature.
While the Triple Top is developing, it can look like other chart patterns.
For example, before the third high forms, the pattern may look like a Double Top.
Three equal highs can also be found in an Ascending Triangle or Rectangle.
With a Triple Top, the support level can be identified by drawing a line at the base level of the lows, which forms a “Neckline“.
You can choose to enter into a short position once the price level falls through this support level.
Preceding trend intensity is also important. A Triple Top emerging after a steep uptrend might be expected to result in a steeper decline.
The Triple Top should also be treated as a neutral chart pattern until a breakdown (downside breakout) occurs.

January
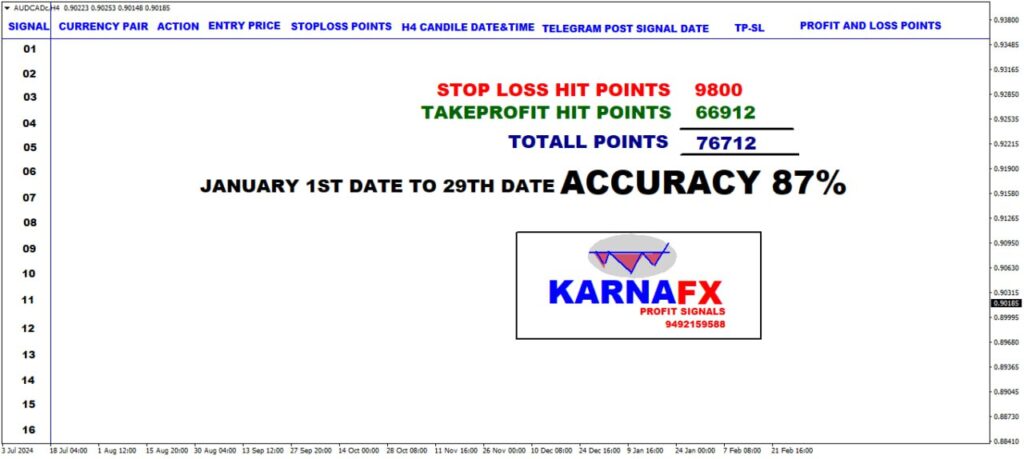
December
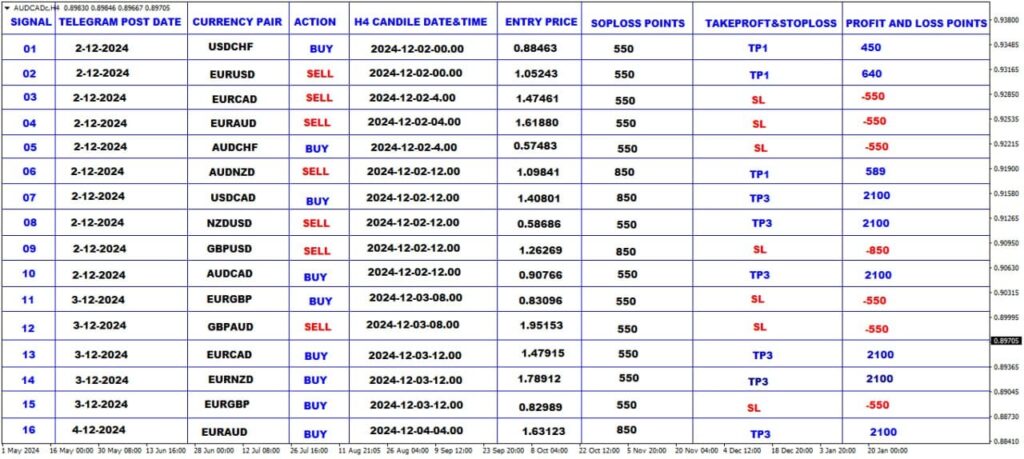
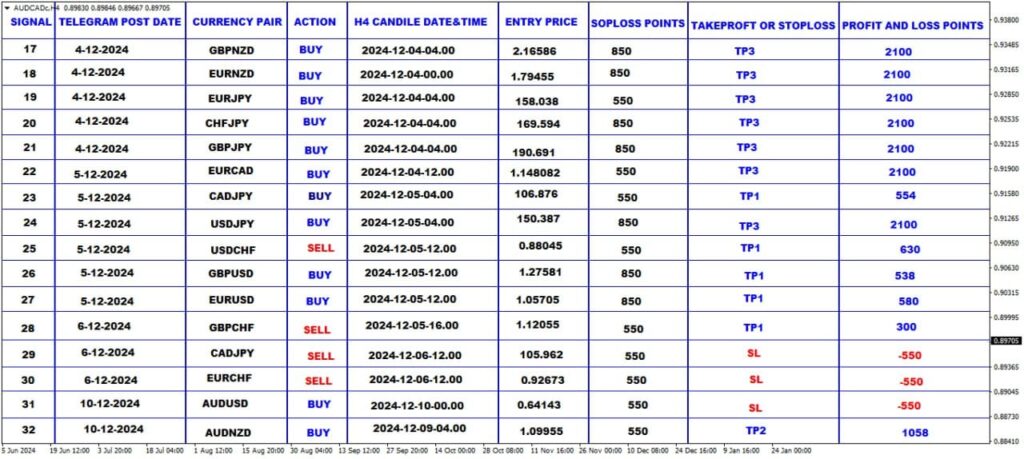
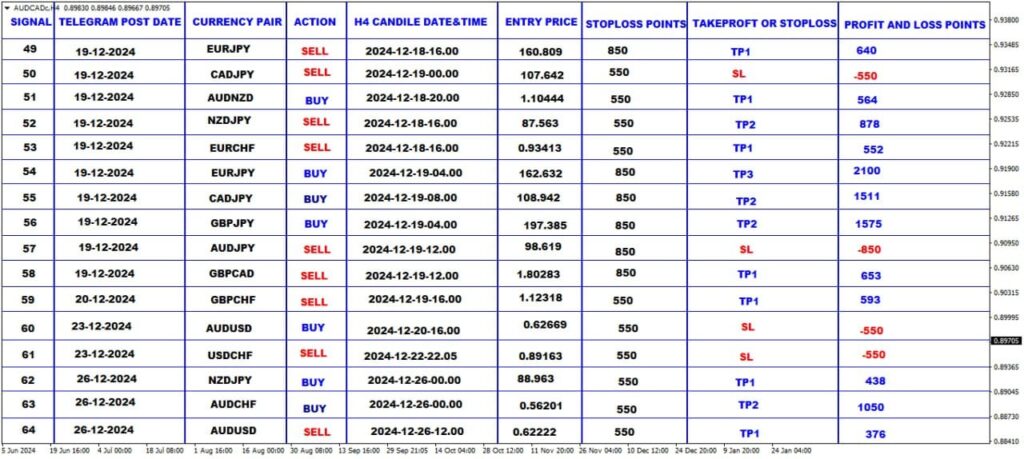
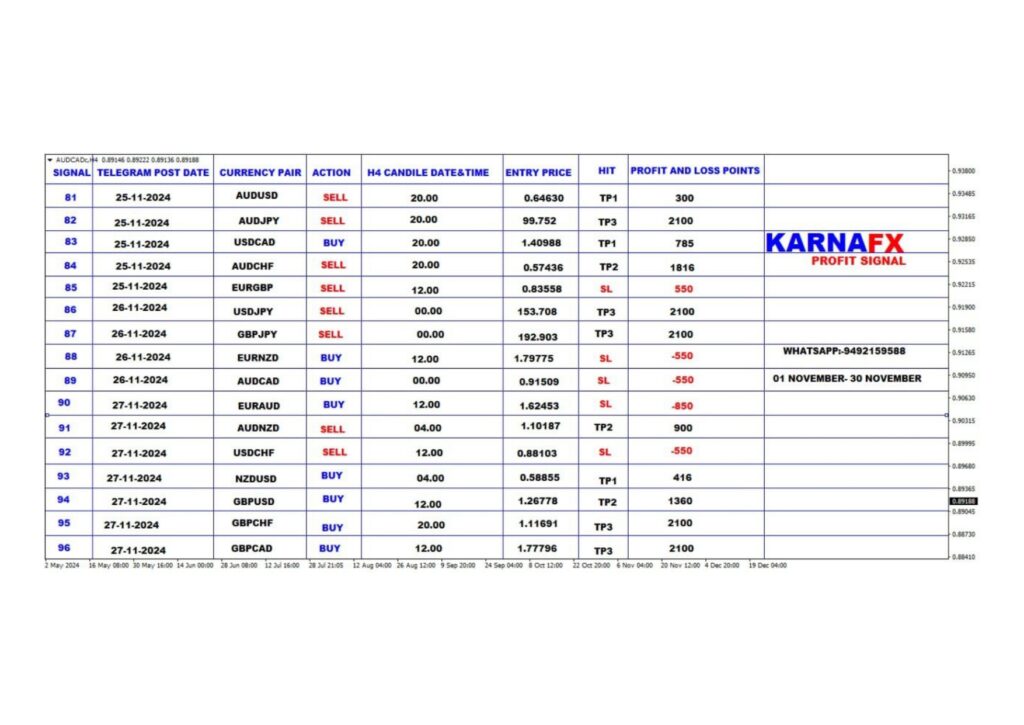
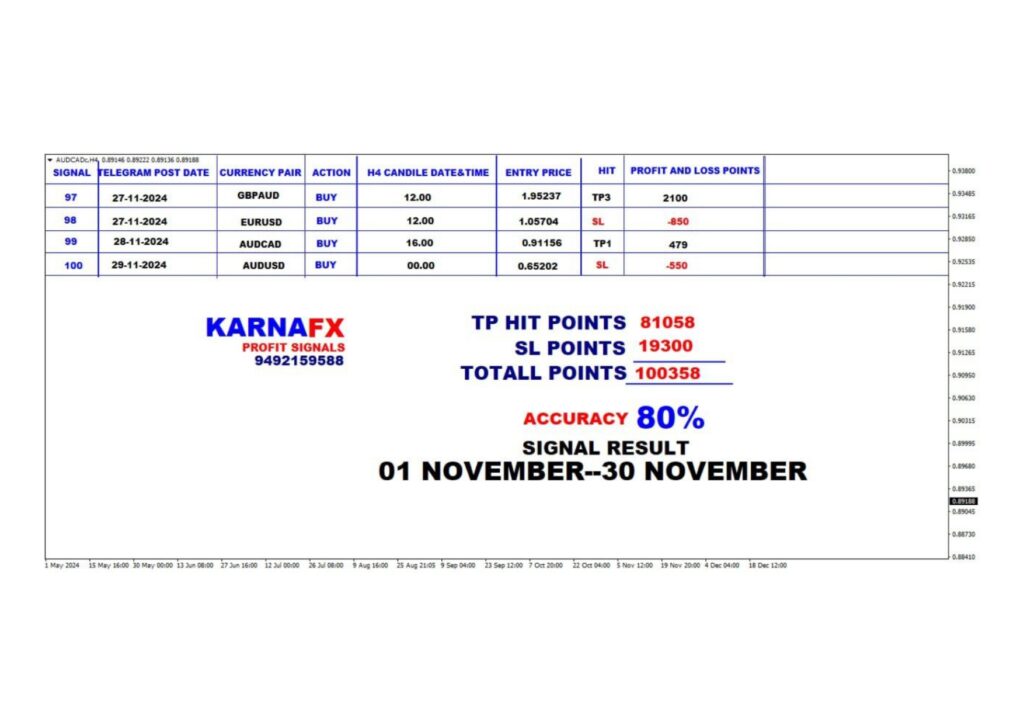
November